Preserve the observation
Save period, filters, timezone and a screenshot. Record the metric and comparison shown. Without this context another team member may inspect a different view and wrongly conclude that the problem has disappeared.
Compare table and export
Check exact values in the table and in an export with the same scope. Investigate delimiters, decimals, dates and encoding. An interpolated curve or truncated axis can create an impression that the underlying numbers do not support.
Test collection
Inspect a representative page and event with the appropriate consent. Check duplicate events, parameters and errors. Adding a second collection mechanism to hide a fault can magnify it rather than resolve the underlying issue.
Document the correction
Record the confirmed cause, change and affected periods. If the cause remains unknown, say so. Retain a post-correction checkpoint and never present reconstructed missing observations as measured data.
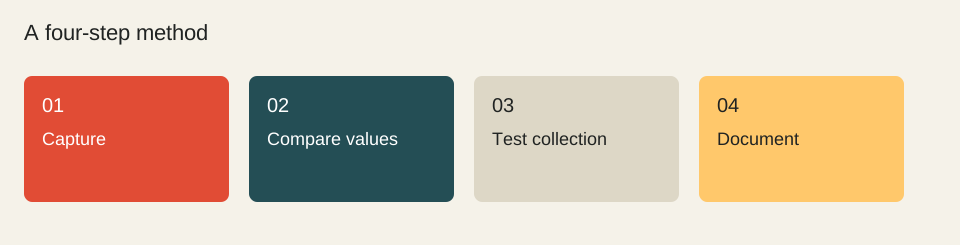
- Capture
- Compare values
- Test collection
- Document
Worked example
Illustrative diagnosis: the graph drops while the table and export remain stable. This directs investigation towards display, but does not yet establish that collection has no other errors.
Check before moving on
These checkboxes are not saved.
Sources & method
Sources reviewed on 1 October 2026. Worked calculations use explicitly hypothetical inputs.
Topic provenance: L’étrange bug graphique de Google Analytics… (2008-03-14). Search Engine Feng Shui. Byline retained in the publication feed: François Houste.
This guide is newly written in 2026. It does not reproduce the earlier text and is not attributed to its historical author.